
Events

- This event has passed.
A Wonderland of Data Visualization
January 9, 2022 , 1:30 pm – 2:30 pm EST
Watch A Wonderland of Data Visualization on YouTube![]()
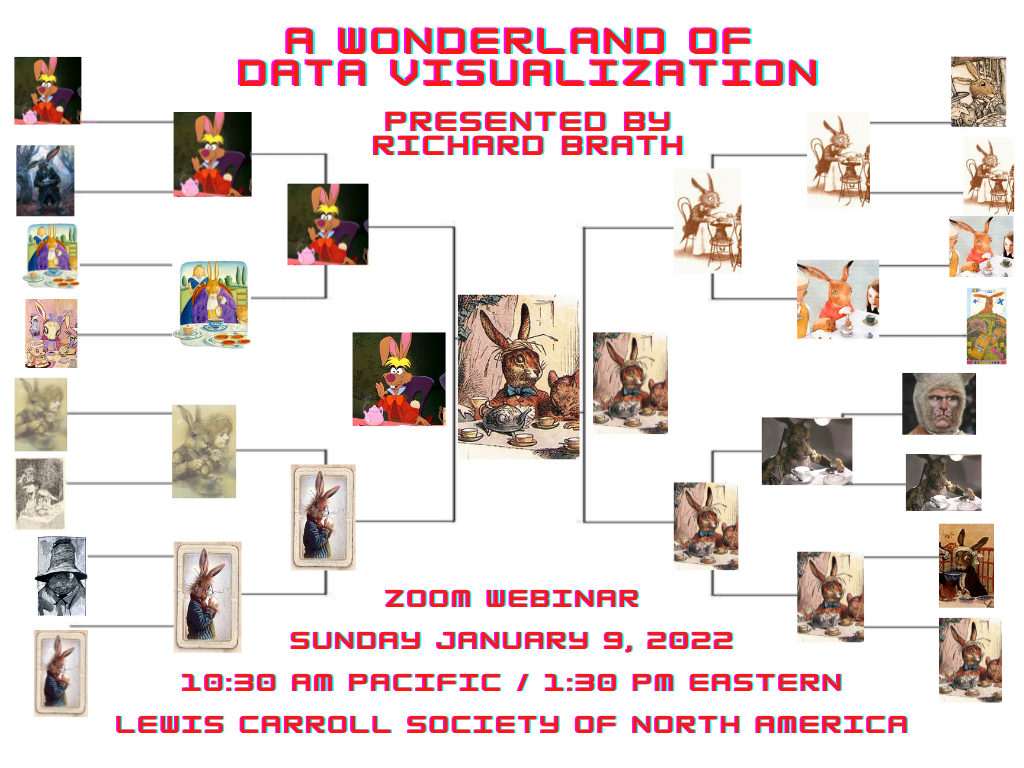
How many ways are there to visualize a book? Longtime visualization designer and researcher Richard Brath decided to find out, using a tome we all know and love. He’ll give us a sampling of his findings as he discusses his peer-review research paper, Surveying Wonderland for many more literature visualization techniques. As always, our inquisitive audience is welcome to join in a lively Q&A following the presentation.
About our speaker: Professionally, Richard Brath is one of the partners of Uncharted Software, Inc. He has recently completed a part-time PhD in data visualization at LSBU. He has authored two books on data visualization: Graph Analysis and Visualization, together with David Jonker (Wiley 2015); and Visualizing with Text (AK Peters, 2020).
